KFSensor Reports
Reports Introduction
The KFSensor Reports module provides a range of reports and graphs that can be used analyse many different aspects of the attacks facing an organization. The reports are particularly useful in highlighting patterns of attacks the are only identifiable over time.
The sections below describe how to access the reports, what the reports do and how to customise the reports to your needs.
Reports Module
To access the KFSensor Reports user the 'View -> Reports' menu item, or press the graph button on the tool bar. Alternatively bookmark the web address in your browser: http://127.0.0.1:8351/
KFSensor reports are available in both Professional and Enterprise editions. In the Enterprise edition there are additional reports which allow different sensors to be compared and there is a sensor filter, to enable events from only one or more sensors to be shown.
KFSensor Reports are only accessible on the same machine that KFSensor is running on. The reason for this is that there is no security encryption or authentication built into the Reports Module. This is the first version of this module and in future releases secure means of enabling remote access will be added.
The Reports module makes use of the latest JavaScript technology. Because of this only the latest browser versions are supported. In particular Internet Explorer 11 or greater must be used. If KFSensor is running on an older version of Windows then the use of Firefox or Chrome is recommended.
The Reports Module uses the capabilities of an SQL database to perform the calculations needed for the reports. It is therefore necessary to configure KFSensor to use a database.
Reports Overview
The KFSensor Reports home page lists all the reports available in the system.
The reports are grouped by the main purpose and what it is that the measure.
Top Ports Reports
The Top Ports reports show which ports have received the most attacks. This helps identify the biggest type of attack on your network.
The totals are calculated across the whole time period of the report and so may be misleading about what is the biggest current threat.
As with other reports the time period used for the calculations can be configured using the filter. See the section below for more information.
Out of the two reports available the 'Top ports by number of visitors' report provides the fairest comparison. This is because certain services are subject to dictionary attacks where an attacker makes repeated calls to try different passwords, generating many events. This report will record this as just one attack.
Top Visitors Reports
The Top Visitor reports are used to identify the most prolific attackers. The reports identify a visitor by its IP, or domain name. The choice of which is configurable. Each report is useful for determining different types of attacker. The 'Top visitors by events' simply shows the top attacker based on the amount of their activity. The 'Top visitors by daily visits' is useful to identify persistent visitors that generate low levels of traffic.Top Sensors Reports
In KFSensor Enterprise the data from multiple sensors is collated into the same database. The 'Top sensors by events' report allows the different levels of traffic to each sensor to be compared.Chronological Reports
The chronological reports show how attacks change over time.Example Investigation and Analysis
The following example is a real life investigation into a particular attack type and shows one way the KFSensor Reports module can be used to analyse the data.Step 1
The 'Top ports by number of visitors' report was run. Most of the ports listed were familiar except for UDP 53413 Netis Router.Step 2
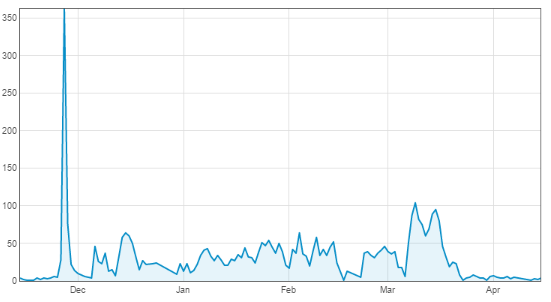
Step 3
The next step was to investigate the background to the attack. A Netis router contains a hard coded password flaw that allows an attacker to take control of it. However this flaw was discovered a year before the spike in attacks. This looks to be the work of a popular exploit kit, that added Netis as an attack and was released in November.Filtering Reports
Each report contains a set of filters that control which events are selected for the report. This enables the reports to be customised to suit a specific investigation. For example by applying the domain filter to 'Events by day' report then the activity from one host can be seen over time.
| Time Period | Controls which days are included in the report. This can either be a relative period suchas the last 7 days, or can be a specified period between two given dates. |
| Protocols to include | Only events with the selected protocols will be included. |
| Ports | Filters the events based on the sensor port number. One or more port numbers may be given. Use a comma to separate them. |
| Visitor IPs | Filters the events based on the visitor's IP address. One or more IPs may be given. Use a comma to separate them. |
| Domain | Filters the events based on the visitor's domain name. Only one domain name may be specified, but the filter it assumes a wild card. e.g. '.tw' will include all visitors whose domain contains .tw |
| Sensors | In KFSensor Enterprise this allows events to be filtered by the sensor that recorded them. |
| Use local time zone | If selected the report calculates the daily totals based on the users local time zone. This will mean that different users in different time zones will receive differing totals. Also the system does not take into account historical changes to summer/winter time, which can make a small difference when showing a chronological report whose period crosses a winter/summer time change. If this option in unchecked then the report is calculated using UCT which never alters. |